Javascript Stacked bar horizontal chart
Today I want to share with you some experience implementing a jquery-based plugin. What is needed is a stacked bar horizontal chart in HTML or javascript, ideally built-in within some plotting framework like jqPlot or whatever, that is free and I can incorporate it into existing architecture to accomplish my requirements. And to my big surprise, I could not find anything really good and convenient to use. Having spent 8 hours digging into different charting frameworks, I came up with the big idea to implement it in my own way.
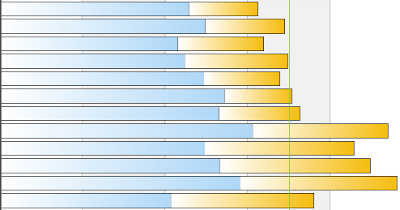
So, we were implementing new web dashboards and we needed to display this type of chart:

That said, none of the existing free javascript frameworks helped to achieve this and I implemented the chart in my own way, spending at all less than 2 working days. Pretty good effort, isn’t it?
As usual, I started from the very end - by writing a few lines of calling code where it is needed; very soon this code will render the chart and whatever else is required. Yeap, I am still a fan of the TDD approach, even though it is not used here. When TDD is not an option, I prefer to implement the code pretty similar to this way: starting from the end-code and then implementing whatever is needed to make that end-code work as expected.
So, the first thing is to access the chart from whatever place I need and do that without defining and maintaining a variable pointing to the chart instance. The second thing is to be able to initialize the chart with some default options. So I came up with this code, which I have put into document.ready event handler:
$.stackedBar.init({
    baseWidth: 260,
    seriesColors: ["#802000", "#E06000", "#E0A000", "#586D8B"]
});
Ok, now it’s time to incorporate the chart into existing architecture. In fact, we are using jqGrid control here, so it should be possible to render the chart inside the grid based on the same model that we are using to build the grid itself. Moreover, I want to separate the code which actually renders the chart from the code which is preparing and manipulating the chart data (if any). This may be useful if we would decide to render data in a different way depending on row number or some other criteria. So far, we came to this:
$(gridSelector).jqGrid({
 url: uri + "Dashboards/RiskIndicators",
 datatype: "json",
 postData: getPostData(args),
 mtype: "POST",
 colModel: function () {
    var colModel = [];
    colModel.push({ name: "ChartData", formatter: formatChart });
    ...
    return colModel;
 },
 afterInsertRow: function (rowid, rowdata, rowelem) {
    ...
    //add data points for stacked bar chart in current row
    var id = getChartId(rowid);
    $.stackedBar.addDataPoints(id, rowdata.Data);
 },
 loadComplete: function(data){
    ...
    $.stackedBar.render();
 },
 onSortCol: function (index, iCol, sortorder) {
    //note: sorting records on current page
    //and keeping the overall scale, i.e. max value
    $.stackedBar.clear(true);
    pageIndex = 0;
 },
 ...
});
Finally, we are ready to implement the plugin itself:
(function($){
 /**
   Plugin for plotting stacked bar horizontal chart
 */
 var _max = 0;
 var _options = {};
 var _data = [];

 function getWidth(value){
  return (value > 0) ?
   Math.ceil((_options.baseWidth * value) /_max) : -1;
 }

 function renderDiv(){
  //render the chart as a set of div elements
  for(var i=0; i<_data.length; i++){
   var chartData = _data[i];
   var width = 0;
   //total relative width of chart container
   var totalWidth = getWidth(chartData.total);
   var mainContainer = $("#" + chartData.id);
   mainContainer.empty();

   //build the series
   var count = chartData.dataPoints.length;
   var nonEmptyPoints = 0;
   for (var idx=count-1; idx >= 0; idx--){
    var value = chartData.dataPoints[idx];
    if (value) {
     var w = getWidth(value);
     //required to display single-digit number, e.g. 1
     var pad = _options.paddingRight;
     var color =_options.seriesColors[idx];

     //build bar element
     if (w >= 0){
      ++nonEmptyPoints;
      width += w;
      var outerDiv = $("<div>").addClass("bar-series")
       .css({"width": w, "padding-right": pad, "background-color": color});
      //add text
      var innerSpan = $("<span>").html(value);
      outerDiv.append(innerSpan);
      mainContainer.append(outerDiv);

      //add tooltip
      var tooltipPrefix = (count > 1) ?
       "Number of Severity " + (count - idx) + "  Events: " : "Number of Observations: ";
      if (innerSpan.width() > outerDiv.width()) {
       outerDiv.empty();
       ((function (div, tooltipValue) {
         return function() {
          div.tooltip({
           bodyHandler: function () {
            return "<span class='bar-series-tooltip'>" + tooltipValue + "</span>";
           },
           delay: 0,
           showURL: false,
           track: true
          });
         };
       })(outerDiv, tooltipPrefix + value))();
      }
     }
    }
   }

   //if empty data
   if (nonEmptyPoints == 0){
    mainContainer.empty().attr("empty", "true").html("0");
   }

   var padding = (_options.paddingRight * nonEmptyPoints) + 1;
   mainContainer.css("width", width + padding);
  }
 }

 //clears the data points and max value (optional)
 var _clear = function(keepMaxValue){
  _data = [];
  if (!keepMaxValue){
   _max = 0;
  }
 };

 var _init = function(options){
  /**
    options:
    width (otherwise width of element is used);
    seriesColors: [];
  */
  _clear();
  _options = {
   baseWidth: 260,
   paddingRight: 0,
   seriesColors: []
  };
  _options = $.extend({}, _options, options);
 };

 var _addDataPoints = function(id, dataPoints){
  var total = 0;
  for(var idx in dataPoints){
   total += dataPoints[idx];
  }
  if (total > _max){
   _max = total;
  }

  _data.push({id: id.toString(), dataPoints: dataPoints, total: total});
 };

 var _render = function(){
  renderDiv();
 };

 //single instance
 $.stackedBar = (function(){
  return {
   init: _init,
   addDataPoints: _addDataPoints,
   render: _render,
   clear: _clear
  };
 })();
})(jQuery)
And some more helper staff we were using here:
function formatChart(el, cellval, opts) {
var id = getChartId(cellval.rowId);
return "<div id="" + id + ""></div>";
}
function getChartId(rowid) {
return "chart-" + rowid;
}
.bar-series-tooltip
{
font-weight:normal;
font-family:Tahoma;
font-size: 11px;
}
.bar-series {
font-weight:bold;
font-family:Tahoma;
font-size: 10px;
height: 15px;
color:#fff;
text-align: center;
padding-top: 1px;
float: right;
overflow: hidden;
}
Final thoughts
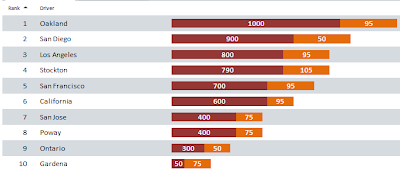
It did not take too much time, I’ve spent no more than two days. The chart is successfully integrated into multiple places in our web portal and works great, with no issues the last year. Here is a real-world example:

